Industrial SCADA Monitoring System
Plant operations teams depend on continuous, trustworthy visibility into the assets they run: pumps, sensors, and other industrial equipment whose definitions are fixed and rarely change once they're established. This is not an environment where operators are constantly adding new device types or reworking what's being watched; the asset list is stable and well-defined, and the operational need is to monitor that stable list with total confidence, continuously, without gaps.
In that environment, the priority was never configurability. What mattered was rock-solid, low-latency monitoring: operators need to see accurate live state at all times, and just as important, they need to be able to trust the numbers on the screen without second-guessing them. A monitoring system that is flexible but occasionally stale, laggy, or ambiguous about what it's actually showing undermines its own purpose in a plant setting. It erodes the operator's confidence in the display and, by extension, in their read of what's happening with the equipment itself.
This system was built as a static-configuration sibling to a more dynamic SCADA platform, a deliberate architectural choice to trade runtime flexibility for simplicity, performance, and operational reliability. Rather than stretching one platform to cover both dynamic and fixed-asset use cases, the fixed nature of this deployment's asset set was treated as a constraint worth designing around directly, accepting less runtime flexibility in exchange for a system that is simpler to reason about, faster to run, and more dependable where it counts.
Real-Time Telemetry Ingestion
A Go backend ingests live sensor and equipment telemetry from IoT devices on the plant floor.
Static Asset Model
Predefined equipment, sensor, and tag definitions that are predictable and easy to reason about.
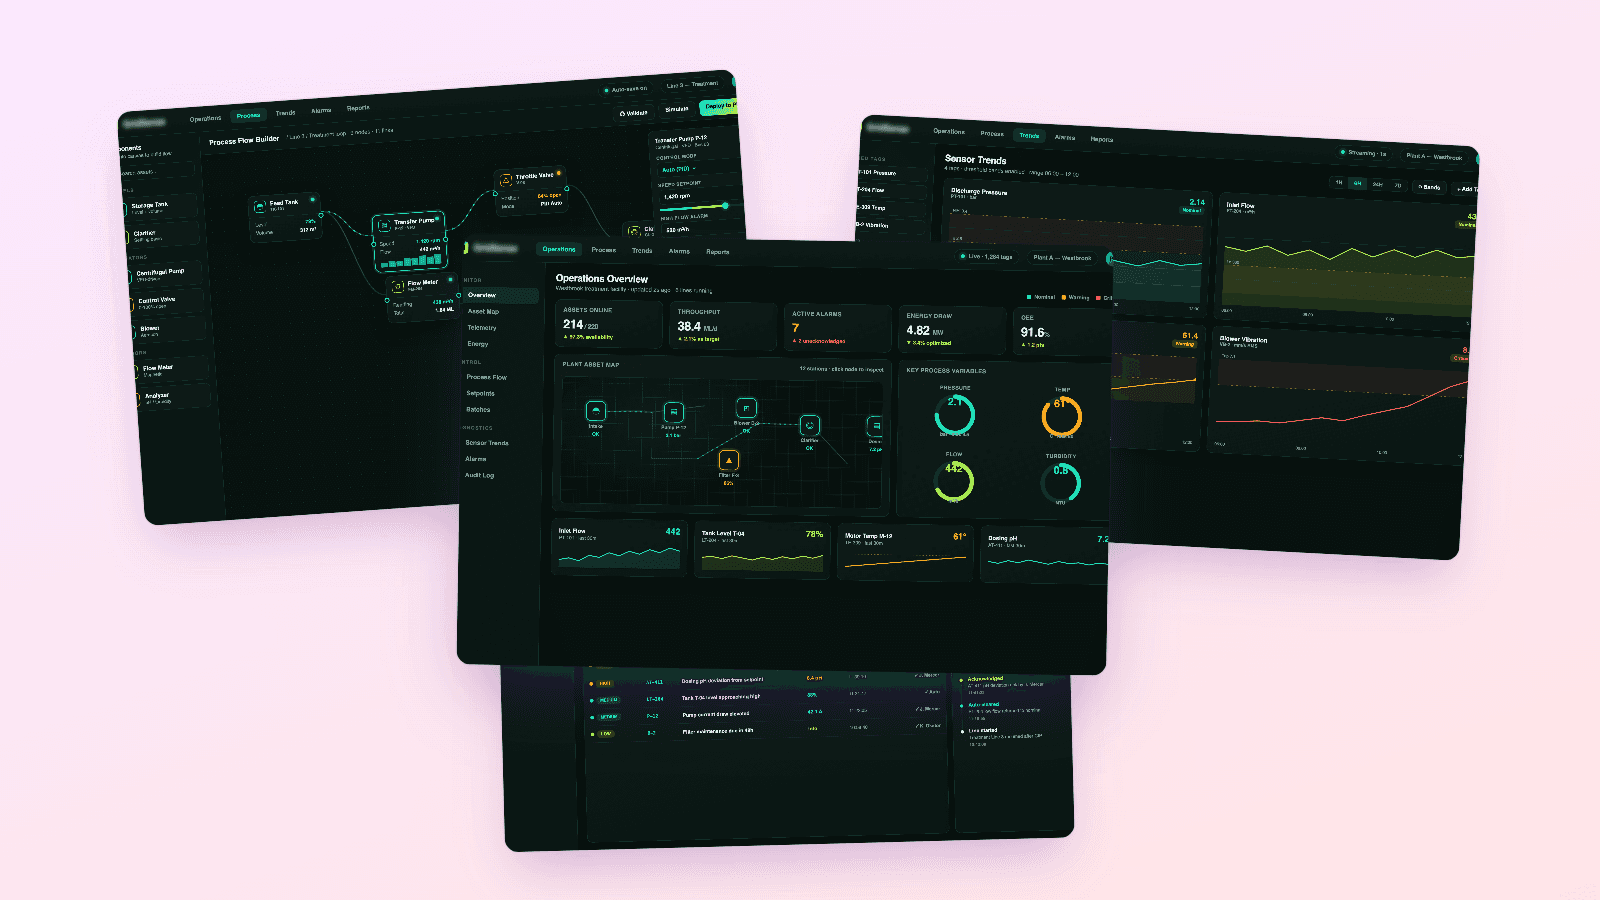
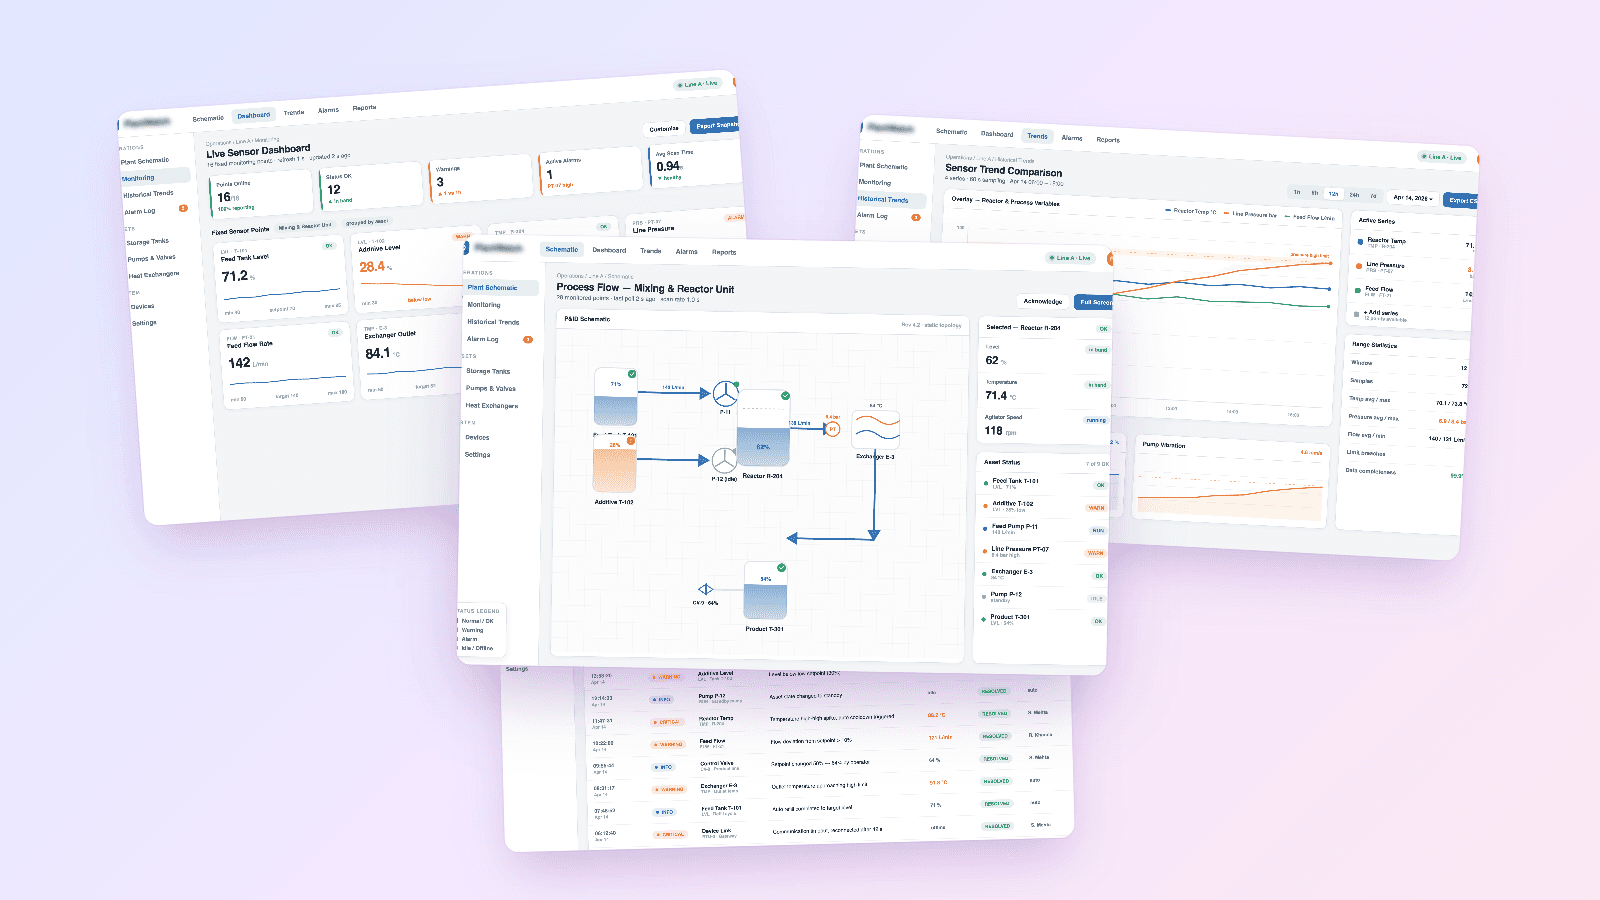
Operator Dashboards
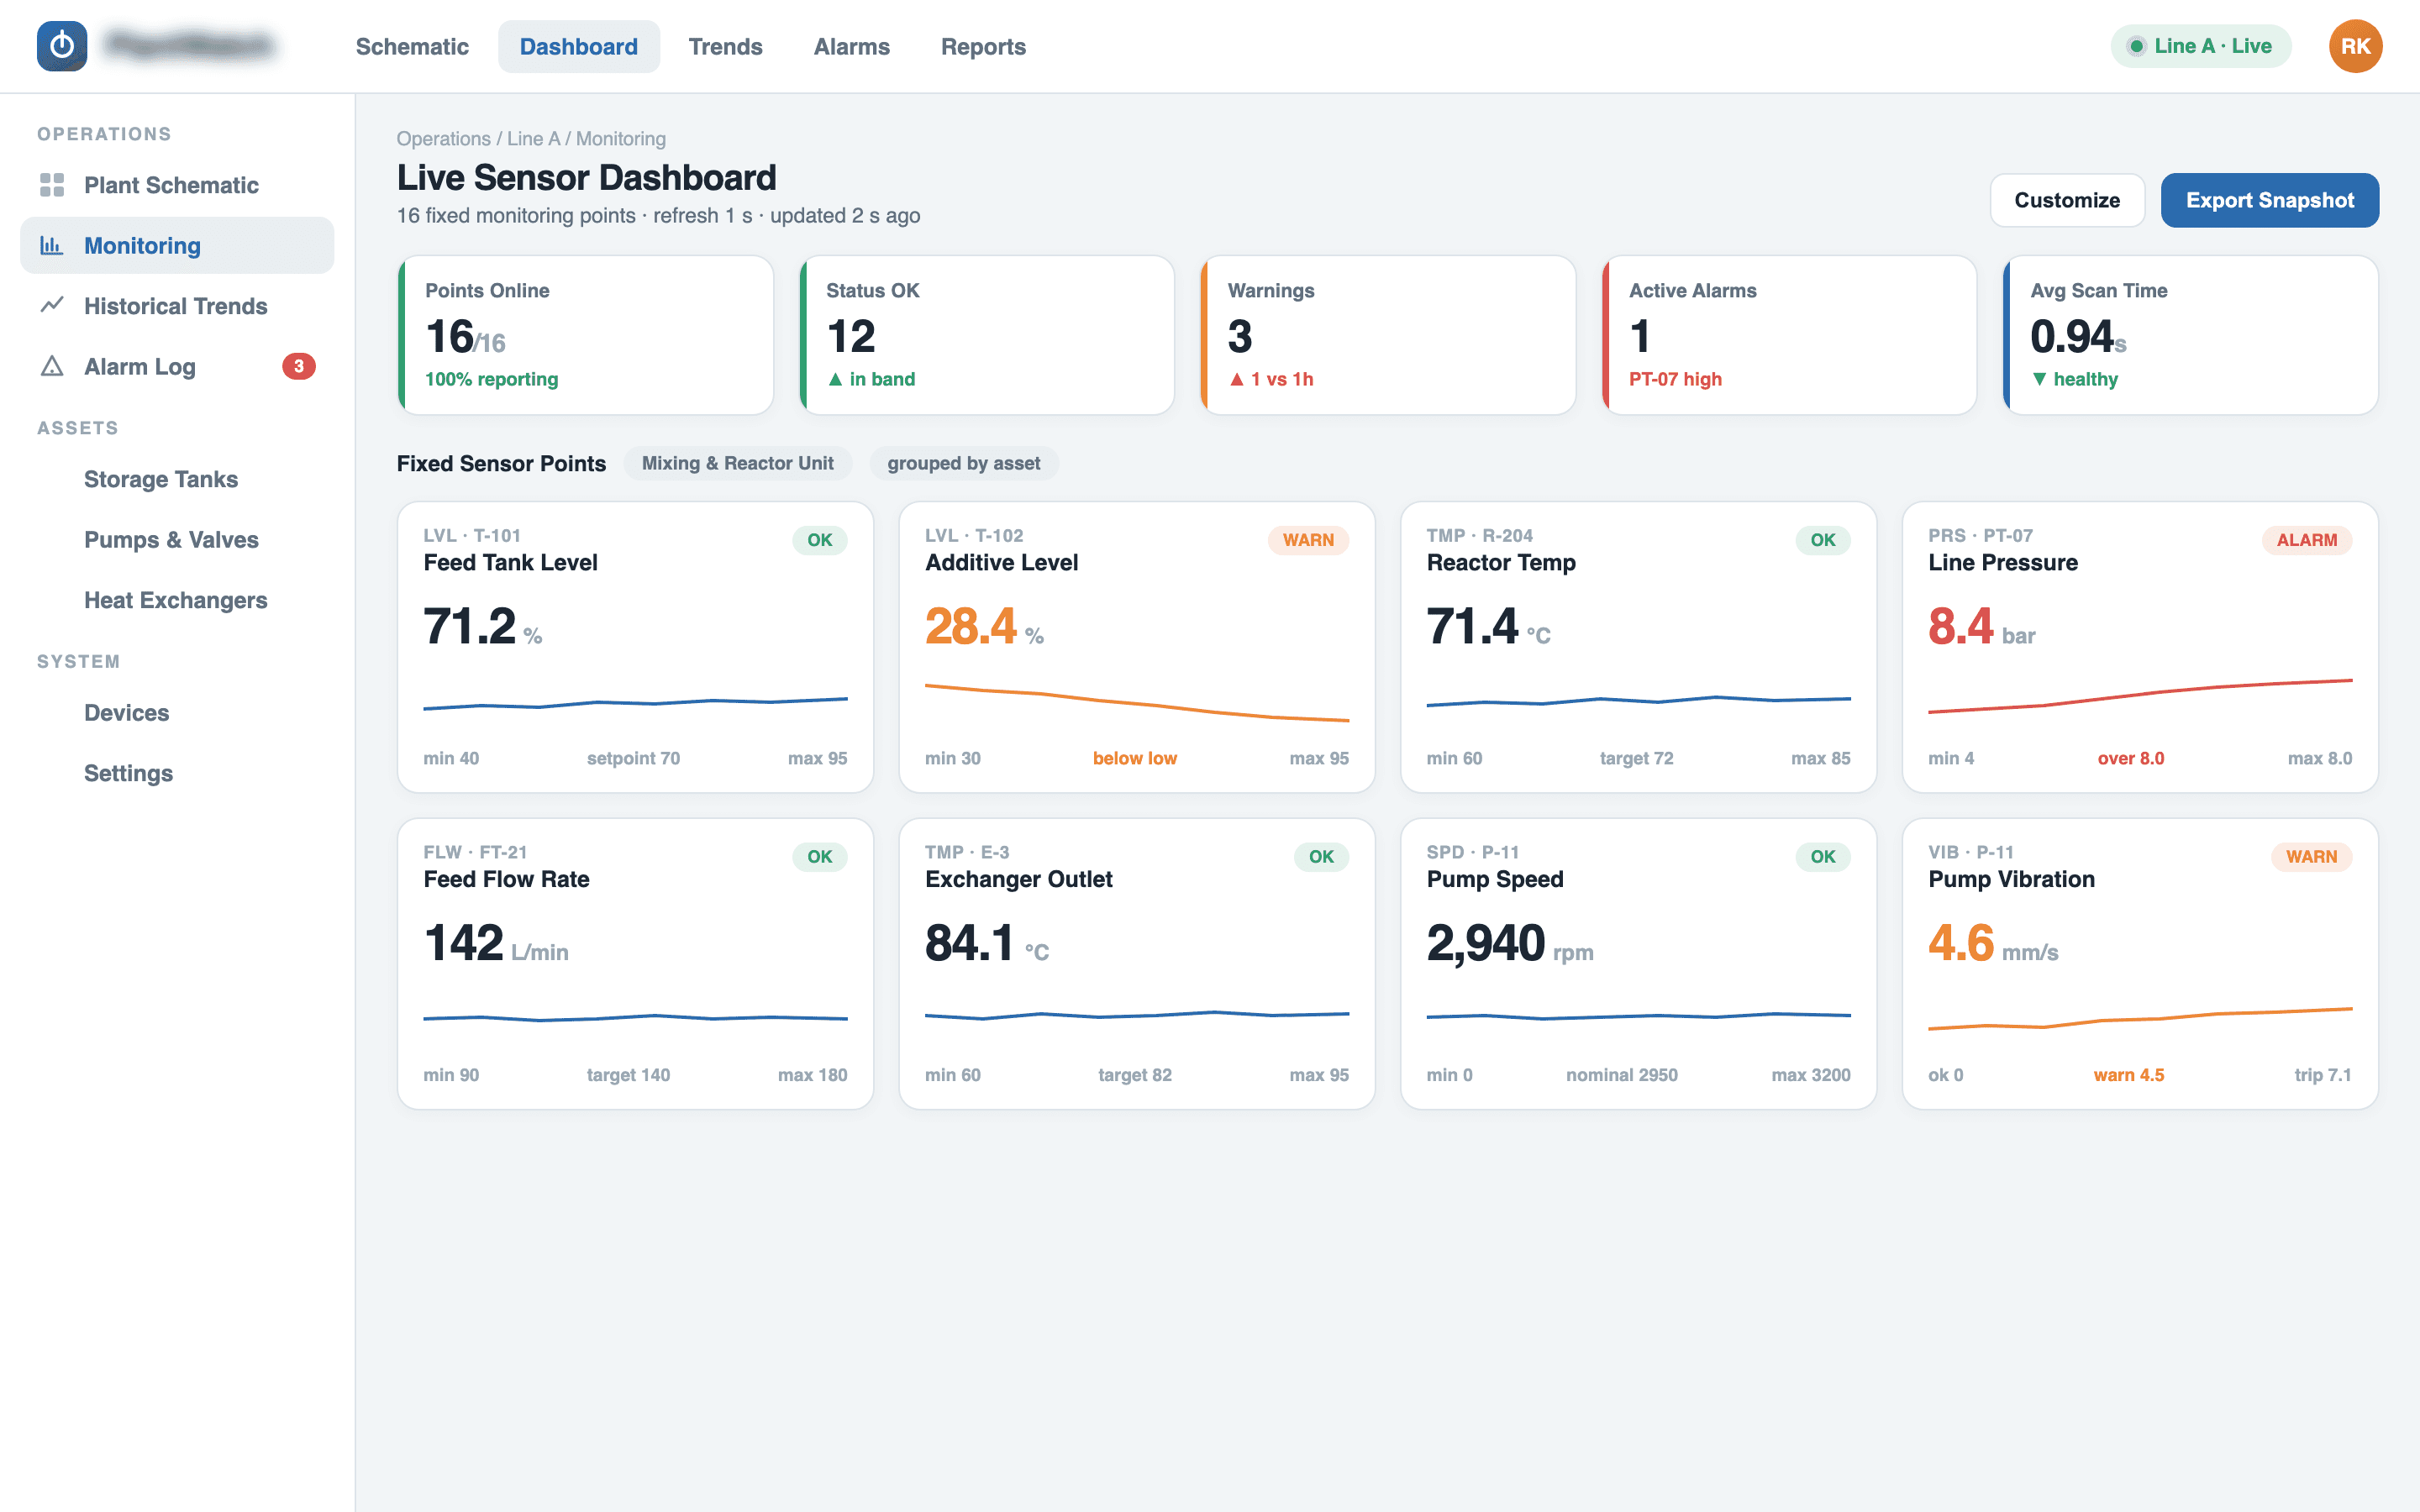
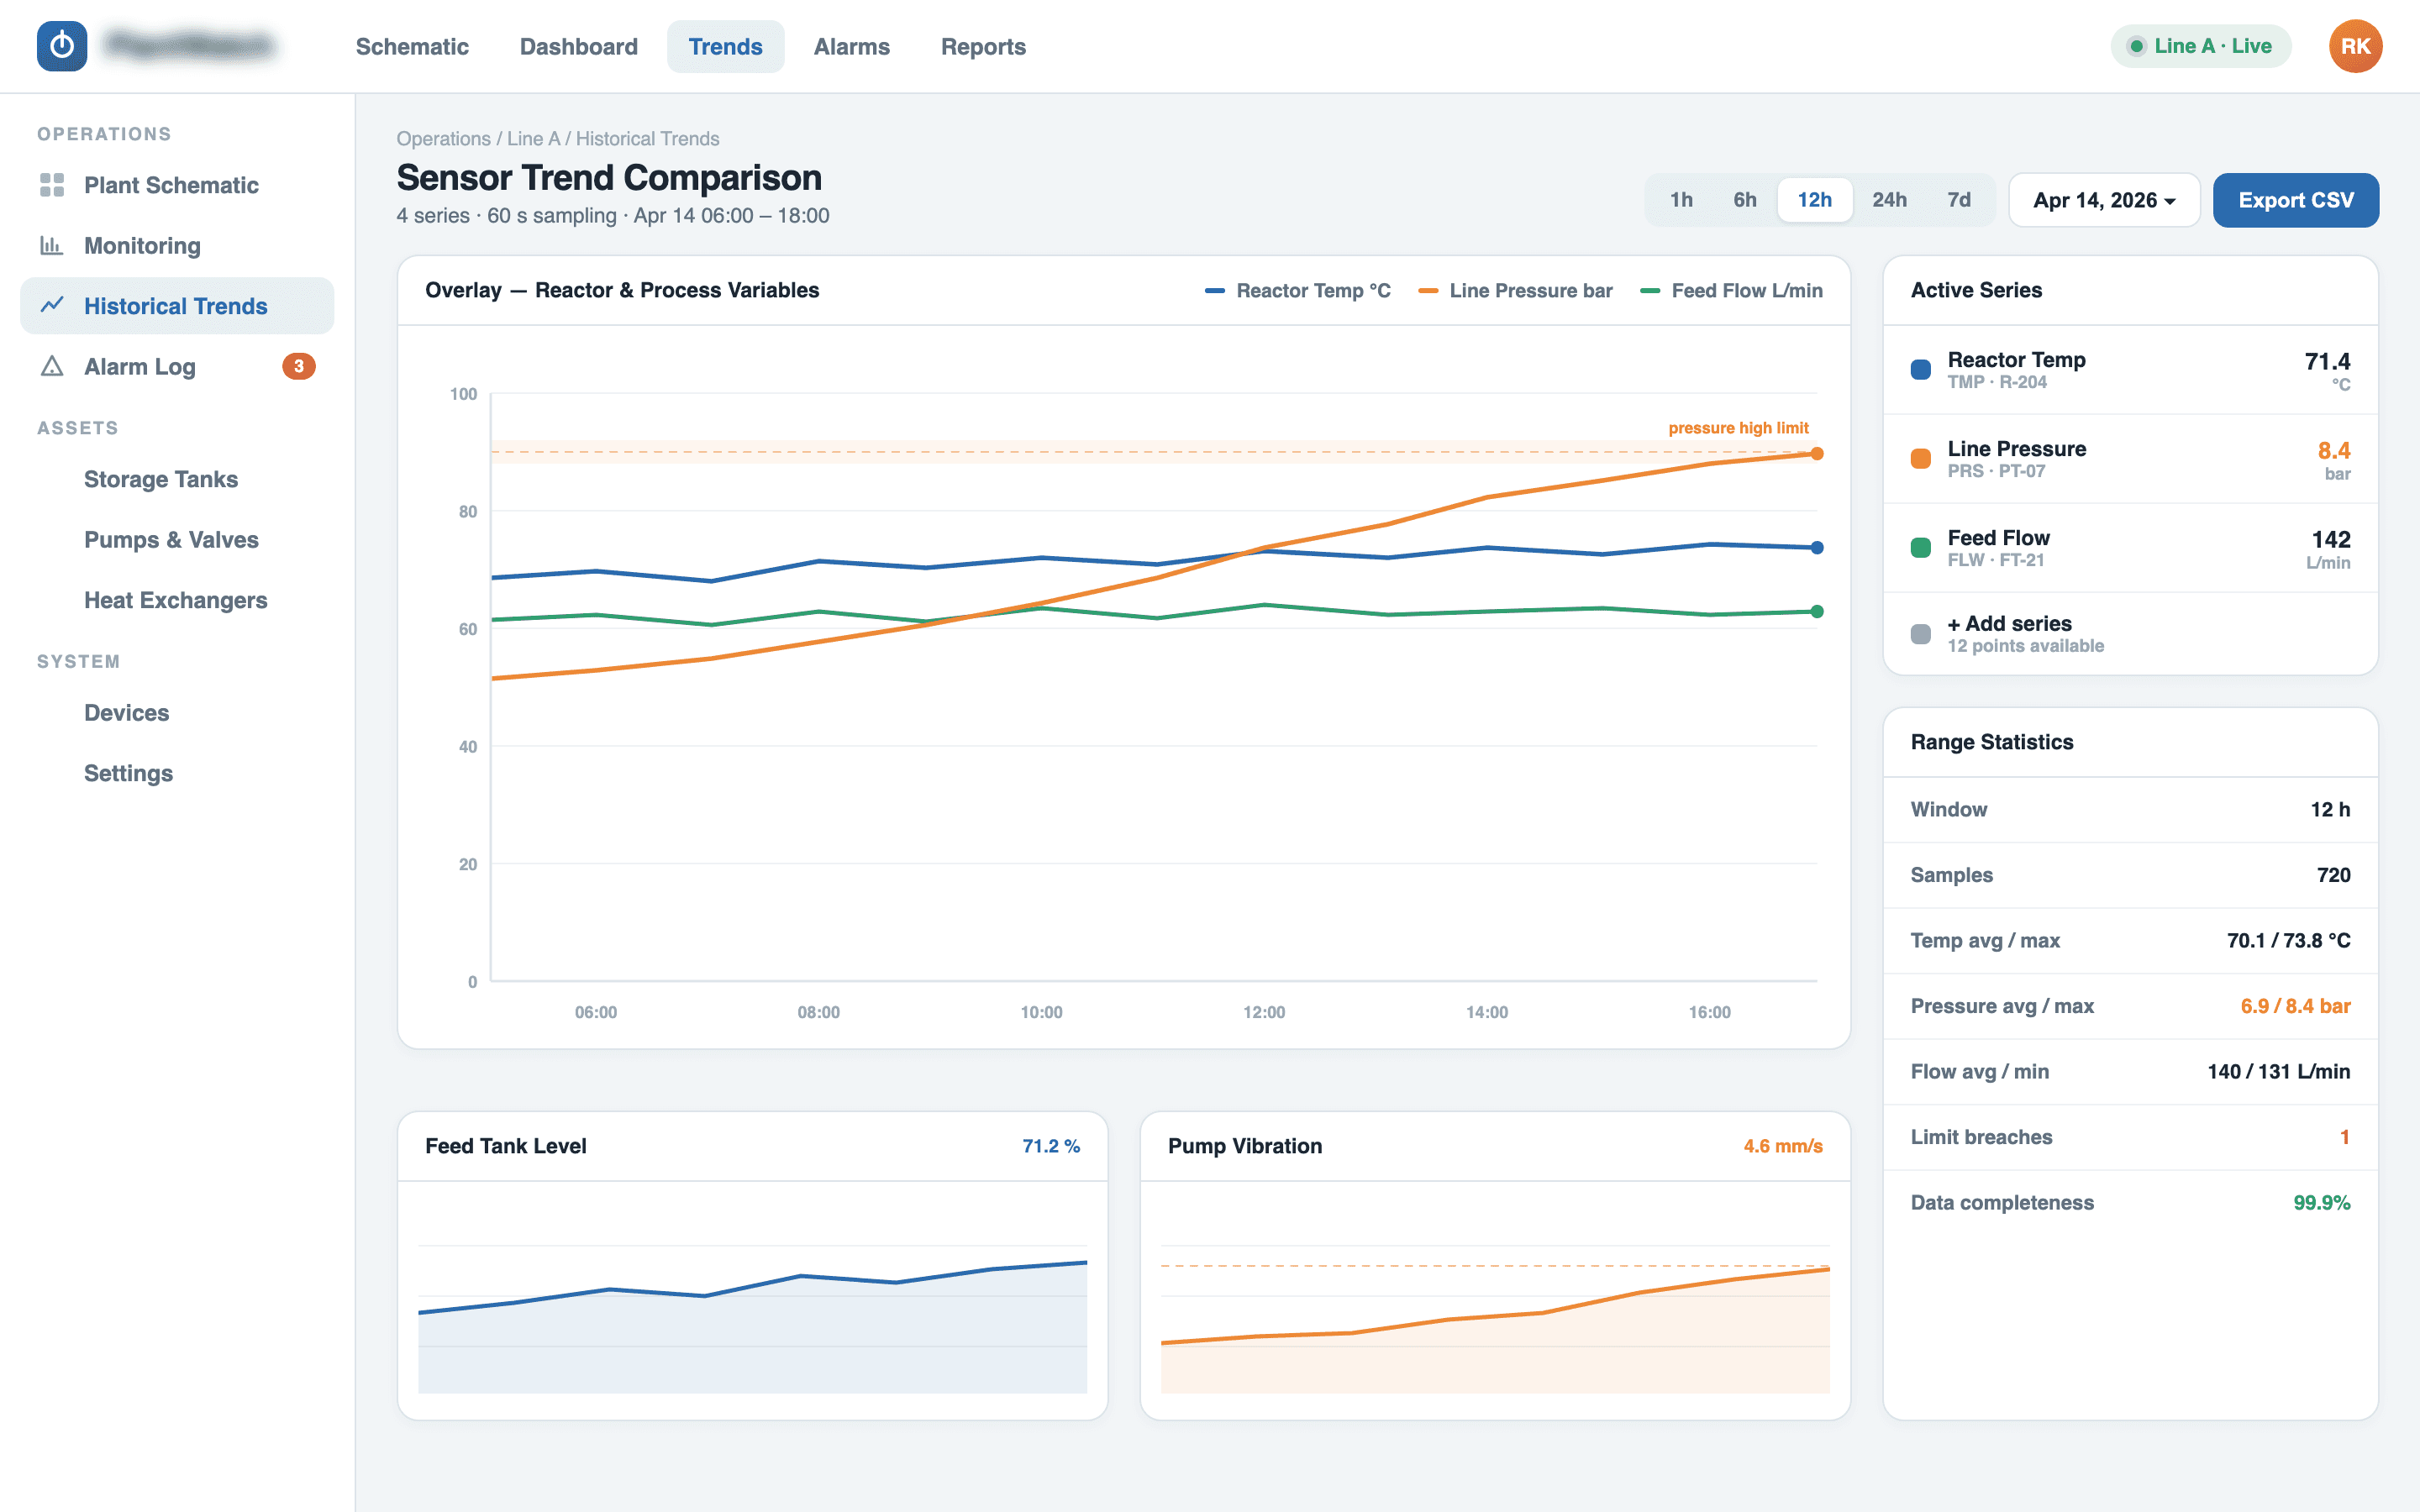
React dashboards visualizing live sensor readings, equipment status, and asset health at a glance.
Live Data Streaming
Dashboard values update continuously as new readings arrive, with no manual refresh.
Threshold Alerts
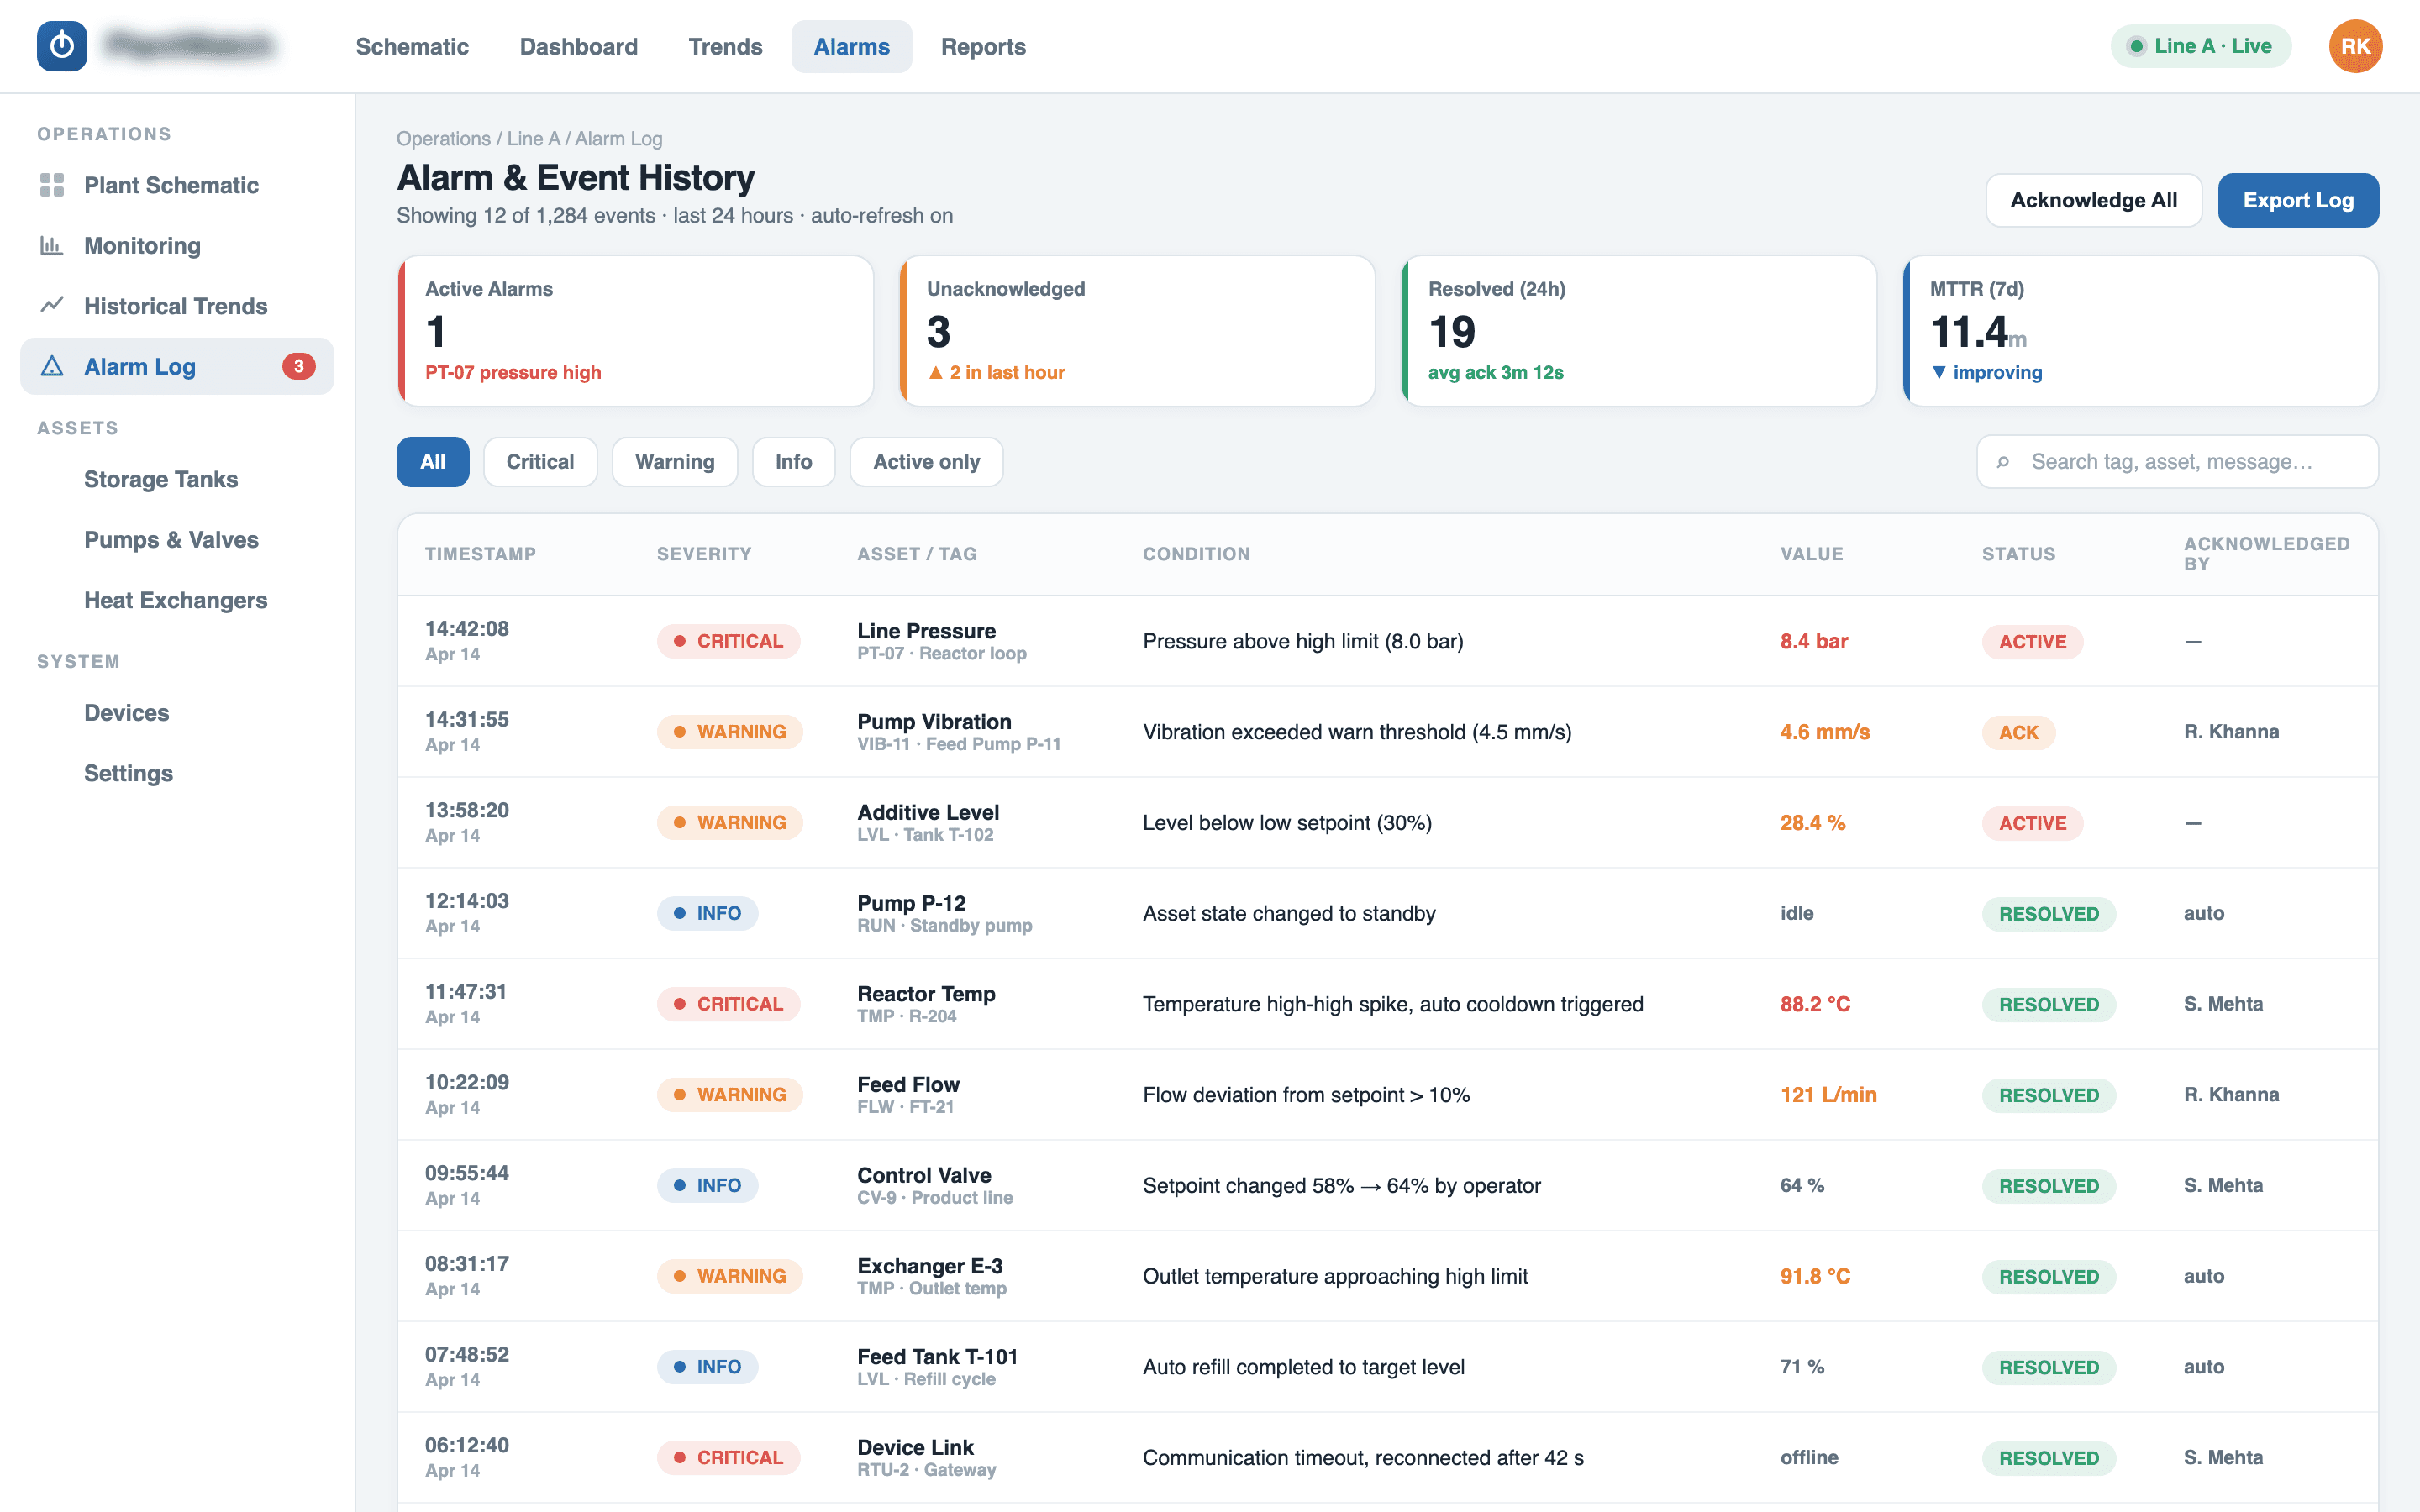
Status indicators surface abnormal readings to operators quickly.
The architecture follows directly from that priority: deterministic, low-latency monitoring took precedence over configurability at every design decision.
- A Go backend was chosen specifically for its concurrency model and its steady, predictable throughput under continuous, high-frequency telemetry ingestion. Industrial monitoring means a constant stream of sensor and equipment readings arriving without pause, and the backend has to keep ingesting and processing that stream without slowdowns or backpressure building up under load. Go's concurrency primitives made it practical to handle many simultaneous data streams from pumps and sensors while keeping throughput steady rather than bursty.
- Asset configuration (the definitions of which pumps, sensors, and equipment the system watches) is baked directly into the system rather than left as something configured at runtime. Because this is safety-relevant monitoring, deterministic behavior mattered more than flexibility: a static configuration means there is no runtime path by which the set of monitored assets can drift or behave unpredictably. That trade-off gives up the ability to add or reconfigure assets on the fly, but it buys certainty about exactly what the system is watching at any given moment.
- Sensor data is pushed to the React frontend in real time rather than the frontend polling the backend on a delay. This keeps operator views genuinely live: what's on screen reflects current equipment state rather than a snapshot that's already out of date. For operators making decisions based on what they see, that immediacy is what separates a display worth trusting from one that's merely indicative.
- The ingestion layer and the visualization layer are kept clearly separate, so the pipeline responsible for collecting and processing telemetry is distinct from the UI responsible for presenting it. This separation lets each half be built and reasoned about on its own terms (a robust, high-throughput pipeline on one side and a responsive, focused UI on the other) rather than coupling ingestion performance to rendering concerns.
- The system delivers reliable, continuous monitoring of a fixed set of industrial assets, giving plant operations exactly the always-on coverage that a well-defined equipment list calls for. Because the asset definitions don't change, the monitoring behavior stays consistent over time rather than requiring ongoing adjustment or re-tuning.
- Operators get a trustworthy real-time view of equipment and sensor state at all times, which means decisions on the plant floor can be made against current conditions rather than delayed or uncertain data. That trust in the numbers on screen (not just the presence of a dashboard, but confidence in what it reports) is the outcome the project was built to deliver.
- The static-configuration design keeps the system predictable and stable in precisely the areas where uptime and correctness matter most. By removing runtime configurability as a source of variability, the system avoids an entire class of failure modes that a more flexible, dynamically configured platform would otherwise need to guard against.
Discovery
Understand the problem, the users, and the real constraints before any design work starts.
Design
Architecture and UX decisions made deliberately, before a line of production code is written.
Build
Iterative development with regular check-ins, so direction can be corrected early and cheaply.
Test
QA and hardening against real-world edge cases before anything reaches production.
Ship & Support
Launch, then stay involved: monitoring, fixes, and iteration as the product keeps growing.